%20scale(0.1008)'%3e%3cpath%20d='M165-700L80-700L80%200L165%200L165-340L455%200L560%200L242-372L545-700L440-700L165-399L165-700ZM1085-700L685-700L685%200L1085%200L1085-80L770-80L770-340L1065-340L1065-420L770-420L770-620L1085-620L1085-700Z'%20fill='%23FFFFFF'%3e%3c/path%3e%3c/g%3e%3c/svg%3e)
%20scale(0.1008)'%3e%3cpath%20d='M165-700L80-700L80%200L165%200L165-340L455%200L560%200L242-372L545-700L440-700L165-399L165-700ZM1085-700L685-700L685%200L1085%200L1085-80L770-80L770-340L1065-340L1065-420L770-420L770-620L1085-620L1085-700Z'%20fill='%2316294B'%3e%3c/path%3e%3c/g%3e%3c/svg%3e)
'%3e%3cpath%20d='M165-700L80-700L80%200L165%200L165-340L455%200L560%200L242-372L545-700L440-700L165-399L165-700ZM890-700L805-700L805%200L890%200L890-700ZM1825-700L1740-700L1740-179L1210-735L1210%200L1295%200L1295-521L1825%2035L1825-700ZM2545-700L2145-700L2145%200L2545%200L2545-80L2230-80L2230-340L2525-340L2525-420L2230-420L2230-620L2545-620L2545-700ZM2785-700L2785-620L2965-620L2965%200L3050%200L3050-620L3230-620L3230-700L2785-700ZM3565-700L3480-700L3480%200L3565%200L3565-700ZM3935-350L3935-350Q3935-432%203971.500-493.500Q4008-555%204067-590Q4126-625%204195-625L4195-625Q4245-625%204286.500-612Q4328-599%204362-575.500Q4396-552%204420-521L4420-521L4420-633Q4376-672%204324-691Q4272-710%204195-710L4195-710Q4122-710%204058.500-683.500Q3995-657%203947-608.500Q3899-560%203872-494Q3845-428%203845-350L3845-350Q3845-272%203872-206Q3899-140%203947-91.500Q3995-43%204058.500-16.500Q4122%2010%204195%2010L4195%2010Q4272%2010%204324-9Q4376-28%204420-67L4420-67L4420-179Q4396-148%204362-124.500Q4328-101%204286.500-88Q4245-75%204195-75L4195-75Q4126-75%204067-110Q4008-145%203971.500-207Q3935-269%203935-350ZM5590-700L5190-700L5190%200L5590%200L5590-80L5275-80L5275-340L5570-340L5570-420L5275-420L5275-620L5590-620L5590-700ZM6110-700L5900-700L5900%200L6110%200Q6212%200%206291-44Q6370-88%206415-166.500Q6460-245%206460-350Q6460-455%206415-533.500Q6370-612%206291-656Q6212-700%206110-700L6110-700ZM6110-85L5985-85L5985-615L6110-615Q6169-615%206218-596.500Q6267-578%206302-543.500Q6337-509%206356-460Q6375-411%206375-350Q6375-289%206356-240Q6337-191%206302-156.500Q6267-122%206218-103.500Q6169-85%206110-85L6110-85ZM7065-355L7065-275L7298-275Q7289-234%207269.500-198Q7250-162%207220-134Q7190-106%207148.500-90.500Q7107-75%207055-75L7055-75Q6981-75%206921-110Q6861-145%206825.500-207Q6790-269%206790-350L6790-350Q6790-432%206825.500-493.500Q6861-555%206921-590Q6981-625%207055-625L7055-625Q7135-625%207194-593.500Q7253-562%207286-506L7286-506L7346-561Q7316-610%207272.500-643Q7229-676%207174.500-693Q7120-710%207055-710L7055-710Q6979-710%206914-683.500Q6849-657%206801-608.500Q6753-560%206726.500-494Q6700-428%206700-350L6700-350Q6700-272%206726.500-206Q6753-140%206801-91.500Q6849-43%206914-16.500Q6979%2010%207055%2010L7055%2010Q7135%2010%207197.500-19.500Q7260-49%207303-100Q7346-151%207368-216.500Q7390-282%207390-355L7390-355L7065-355ZM8075-700L7675-700L7675%200L8075%200L8075-80L7760-80L7760-340L8055-340L8055-420L7760-420L7760-620L8075-620L8075-700Z'%20fill='%2316294B'%3e%3c/path%3e%3c/g%3e%3c/svg%3e)
'%3e%3cpath%20d='M165-700L80-700L80%200L165%200L165-340L455%200L560%200L242-372L545-700L440-700L165-399L165-700ZM890-700L805-700L805%200L890%200L890-700ZM1825-700L1740-700L1740-179L1210-735L1210%200L1295%200L1295-521L1825%2035L1825-700ZM2545-700L2145-700L2145%200L2545%200L2545-80L2230-80L2230-340L2525-340L2525-420L2230-420L2230-620L2545-620L2545-700ZM2785-700L2785-620L2965-620L2965%200L3050%200L3050-620L3230-620L3230-700L2785-700ZM3565-700L3480-700L3480%200L3565%200L3565-700ZM3935-350L3935-350Q3935-432%203971.500-493.500Q4008-555%204067-590Q4126-625%204195-625L4195-625Q4245-625%204286.500-612Q4328-599%204362-575.500Q4396-552%204420-521L4420-521L4420-633Q4376-672%204324-691Q4272-710%204195-710L4195-710Q4122-710%204058.500-683.500Q3995-657%203947-608.500Q3899-560%203872-494Q3845-428%203845-350L3845-350Q3845-272%203872-206Q3899-140%203947-91.500Q3995-43%204058.500-16.500Q4122%2010%204195%2010L4195%2010Q4272%2010%204324-9Q4376-28%204420-67L4420-67L4420-179Q4396-148%204362-124.500Q4328-101%204286.500-88Q4245-75%204195-75L4195-75Q4126-75%204067-110Q4008-145%203971.500-207Q3935-269%203935-350ZM5590-700L5190-700L5190%200L5590%200L5590-80L5275-80L5275-340L5570-340L5570-420L5275-420L5275-620L5590-620L5590-700ZM6110-700L5900-700L5900%200L6110%200Q6212%200%206291-44Q6370-88%206415-166.500Q6460-245%206460-350Q6460-455%206415-533.500Q6370-612%206291-656Q6212-700%206110-700L6110-700ZM6110-85L5985-85L5985-615L6110-615Q6169-615%206218-596.500Q6267-578%206302-543.500Q6337-509%206356-460Q6375-411%206375-350Q6375-289%206356-240Q6337-191%206302-156.500Q6267-122%206218-103.500Q6169-85%206110-85L6110-85ZM7065-355L7065-275L7298-275Q7289-234%207269.500-198Q7250-162%207220-134Q7190-106%207148.500-90.500Q7107-75%207055-75L7055-75Q6981-75%206921-110Q6861-145%206825.500-207Q6790-269%206790-350L6790-350Q6790-432%206825.500-493.500Q6861-555%206921-590Q6981-625%207055-625L7055-625Q7135-625%207194-593.500Q7253-562%207286-506L7286-506L7346-561Q7316-610%207272.500-643Q7229-676%207174.500-693Q7120-710%207055-710L7055-710Q6979-710%206914-683.500Q6849-657%206801-608.500Q6753-560%206726.500-494Q6700-428%206700-350L6700-350Q6700-272%206726.500-206Q6753-140%206801-91.500Q6849-43%206914-16.500Q6979%2010%207055%2010L7055%2010Q7135%2010%207197.500-19.500Q7260-49%207303-100Q7346-151%207368-216.500Q7390-282%207390-355L7390-355L7065-355ZM8075-700L7675-700L7675%200L8075%200L8075-80L7760-80L7760-340L8055-340L8055-420L7760-420L7760-620L8075-620L8075-700Z'%20fill='%23FFFFFF'%3e%3c/path%3e%3c/g%3e%3c/svg%3e)
Kafka Toolage: Grafana
First written September 2022, last updated September 2026.
Introduction
Using Grafana to monitor an Apache Kafka cluster takes a fair amount of infrastructure, and it has to fit your cluster's security configuration. While there are plenty of examples out there, you can spend a lot of time adjusting dashboards to get a desired setup.
In short
- JMX metrics are a great way to see the health of an Apache Kafka Cluster.
- Grafana Dashboards are a great visualization of Kafka components, including applications built with the kafka-clients or kafka-streams Java libraries.
- A complete example of using Grafana against 4 differently configured clusters is available in kafka-toolage repository.
- The coupling of JMX Prometheus Exporter configuration, Prometheus scraping, and Grafana queries makes it harder to combine dashboards from others.
- The dashboards here are based on our experience, with a lot of inspiration from Confluent’s GitHub repository (Apache 2.0 License).
Important Considerations
- Kafka Monitoring by Grafana isn't a turnkey solution; expect an investment of time from your organization.
- Grafana’s license changed to AGPLv3, from Apache License 2.0, in April 2021. Review it and make sure this works for your organization.
- Using JMX Prometheus Exporter exposes broker metrics to a RESTful endpoint; enable security if that endpoint is accessible outside the Kafka tools network.
- Scraping JMX metrics through the endpoint can impact performance; tune accordingly by only exporting specific metrics and reducing the frequency Prometheus scrapes them.
Infrastructure Needed
- JMX Prometheus Exporter Agent attached to every monitored JVM
- JMX Prometheus Exporter Configuration for each service
- ZooKeeper
- Brokers
- Connect
- Schema Registry
- Clients (if desired)
- Prometheus
- Configuration for each JVM to pull in the data from the agents
- Grafana
- Prometheus Integration
- Dashboards
- Variables to allow for supporting multiple clusters
It's a long list. Take it one piece at a time.
Software
This is the software and the versions used at the time of this writing.
| Component | Container | License | Latest Version |
|---|---|---|---|
| Prometheus JMX Exporter | N/A | Apache License 2.0 | 0.16.1¹ (2021-07-14) |
| Prometheus | Docker | Apache License 2.0 | 2.38.0 (2022-08-16) |
| Grafana | Docker | GNU AGPL v3.0 | 9.1.4 (2022-09-09) |
¹ At the time of writing, the latest version was 0.17.0 (2022-05-23), but it wasn't working because of a dependency issue resulting in an unknown field value. We saw no technical or security reason to be on 0.17.0.
noauth-broker-1 | Exception in thread "main" java.lang.reflect.InvocationTargetExceptionnoauth-broker-1 | ...noauth-broker-1 | at java.instrument/sun.instrument.InstrumentationImpl.loadClassAndCallPremain(InstrumentationImpl.java:525)noauth-broker-1 | Caused by: java.lang.NoSuchFieldError: UNKNOWNnoauth-broker-1 | at io.prometheus.jmx.JmxCollector$Rule.<init>(JmxCollector.java:57)The Challenges
- The Grafana project doesn't provide Kafka dashboards. There are various ones out there, and their configuration is coupled to the configuration of JMX Prometheus Exporter as well as how that is integrated into Prometheus.
- Typically, clients already use Grafana for other dashboards and want to customize the experience, but that means the organization takes on the maintenance and configuration of the dashboards, which takes time.
- Some metrics that belong in Grafana dashboards can't be obtained from JMX; this disconnect can lead to challenges.
- Monitoring clients (producers, consumers, and stream applications) requires exporting and scraping their metrics. While the repository provides Kafka client dashboards, it isn't reviewed here.
- Also, JMX monitoring of clients is only available in the Java client. JMX is a Java monitoring API and not implemented by
librdkafkaor other non-Java client libraries.
Setup
Adding Grafana to your Apache Kafka tooling has many steps. Some of these pieces require working with your organization to make sure you comply with any security considerations. While exposing JMX Metrics is a read-only operation, that doesn’t mean security isn't an issue.
Since setup is an important part of considering a tool, we'll walk through various parts of the setup process. Use the example repository for complete details.
JMX Prometheus Exporter
If you are new to JMX Metrics and the JMX Prometheus Exporter, start with a simple configuration to expose all metrics. Eventually, limit the metrics to only those needed to power the dashboards.
Configuration
This configuration exposes all.
config.yml - everything
lowercaseOutputName: truerules:- pattern: .*Integration
Add the JVM agent to each component. For Apache Kafka components, add this to your KAFKA_OPTS environment variable.
-javaagent:/jmx_prometheus_javaagent.jar=7071:/config.ymlValidation
Testing is simple.
% curl http://localhost:7071Adjustment
Trim the configuration to only the metrics you need, replacing . with specific patterns. This reduces the burden on the services for providing these metrics.
- pattern: kafka.server<type=BrokerTopicMetrics, name=BytesInPerSec, topic=(.+)><>OneMinuteRateconfig.yml - specific rules
lowercaseOutputName: truerules: - pattern: kafka.server<type=BrokerTopicMetrics, name=BytesInPerSec, topic=(.+)><>OneMinuteRate - pattern: kafka.network<type=RequestMetrics, name=(.+), request=(.+)><>999thPercentile - pattern: kafka.network<type=RequestMetrics, name=(.+), request=(.+)><>99thPercentile - pattern: kafka.network<type=RequestMetrics, name=(.+), request=(.+)><>95thPercentileSome JMX metrics can't be scraped without mapping parameters to labels. Informational metrics, such as version strings, would need a mapping to expose the attribute/value as labels and provide a dummy value (Grafana expects numerical metric values). This is an example of accessing the broker version from an app-info metric.
- pattern: "kafka.server<type=app-info, id=(.+)><>(.*): (.*)" name: kafka_server_app_info_$2 labels: kafka_broker: "$1" kafka_version: "$3" value: 1Our recommendation: only rewrite patterns when absolutely necessary.
Prometheus
Prometheus is a time-series database used to capture the scraped metrics. It has to be configured to scrape the data and store it. Getting Prometheus’ configuration right is the key to supporting multiple types of clusters and multiple instances. For this project, a cluster_type label is added to separate out statistics from brokers, connect, and schema-registry. A cluster_id is added to identify each cluster.
Configuration
To pull the JMX Prometheus Exporter endpoint into Prometheus, you need to set up a job as a scraped configuration. Prometheus provides many service-discovery mechanisms. The mechanism you use depends on the infrastructure of your organization. For this setup static_configs is used. To add client metrics, we would use file_sd_configs for demonstration and kubernetes_sd_config for applications deployed within Kubernetes.
Here is the configuration for the noauth brokers. The additional labels make it easier to separate metrics within Grafana. The relabel_ allows for the removal of the port from the target’s name.
prometheus.yml
global:scrape_interval: 15s scrape_configs: - job_name: noauth-kafka static_configs: - targets: - noauth-broker-1:7071 - noauth-broker-2:7071 - noauth-broker-3:7071 labels: cluster_type: "kafka" cluster_id: "noauth" relabel_configs: - source_labels: [__address__] regex: '(.*):(.*)' target_label: instance replacement: '$1'Validation
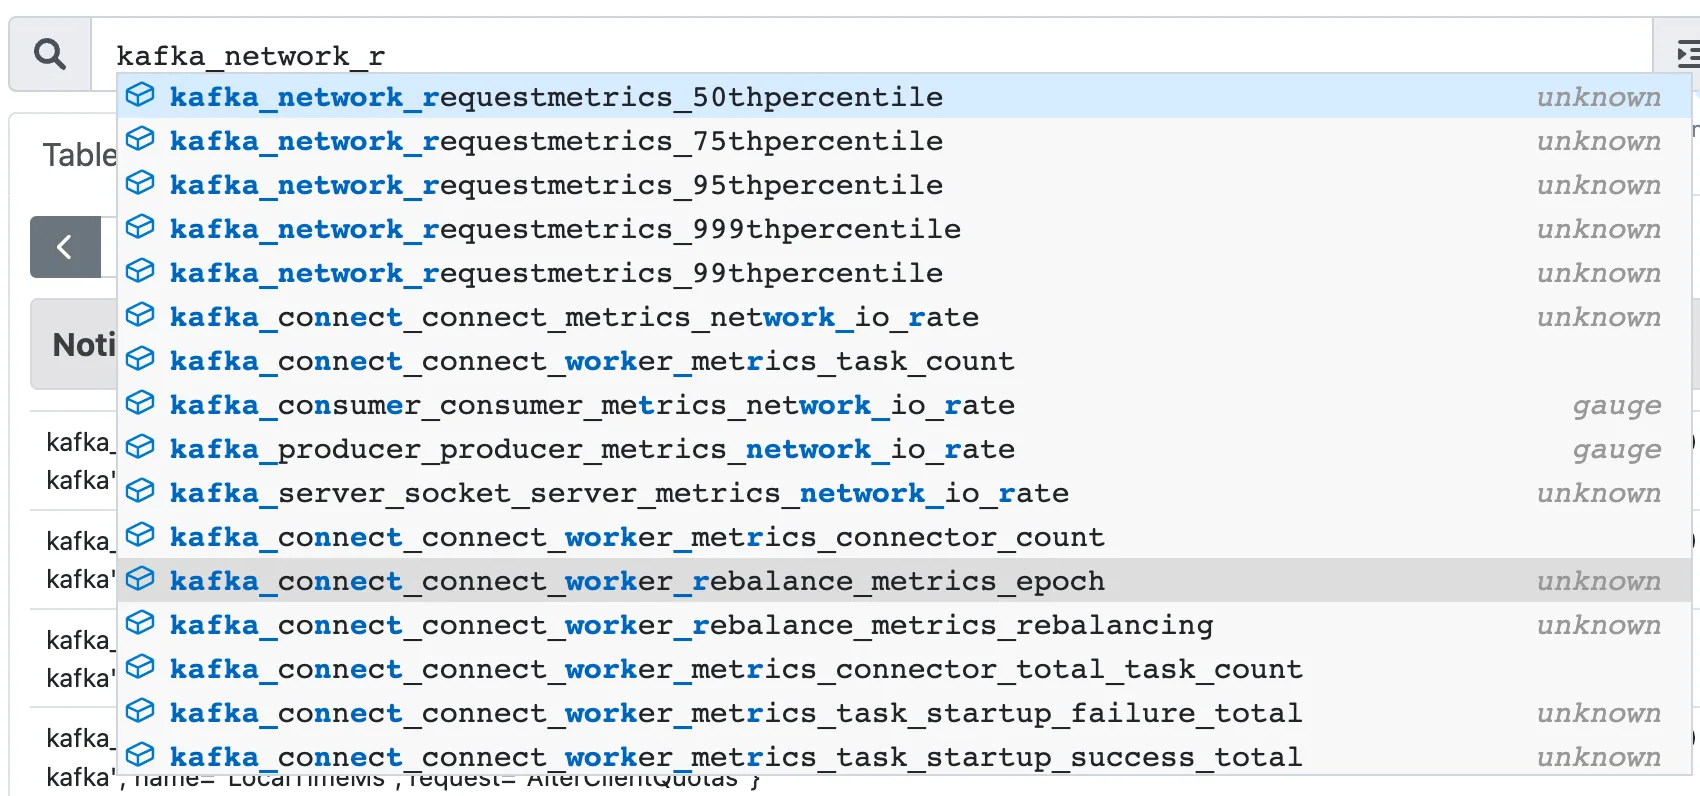
Prometheus provides a nice web interface for inspecting its database. With Prometheus’ built-in autocomplete, you can start typing a metric name and see current metrics that match.
This Prometheus UI is the best way to validate JMX metrics gathering and configuration. Checking the JMX Prometheus Exporter endpoint works, but it won't show the additional labels added through Prometheus, so use the Prometheus UI. There are additional inspections available to confirm your jobs are configured as expected.
NOTE
Storage is based on retention and sampling. The default retention is 15 days. To change the retention time, use the command line parameter -.
needed_disk_space = retention_time_seconds * ingested_samples_per_second * bytes_per_sampleGrafana
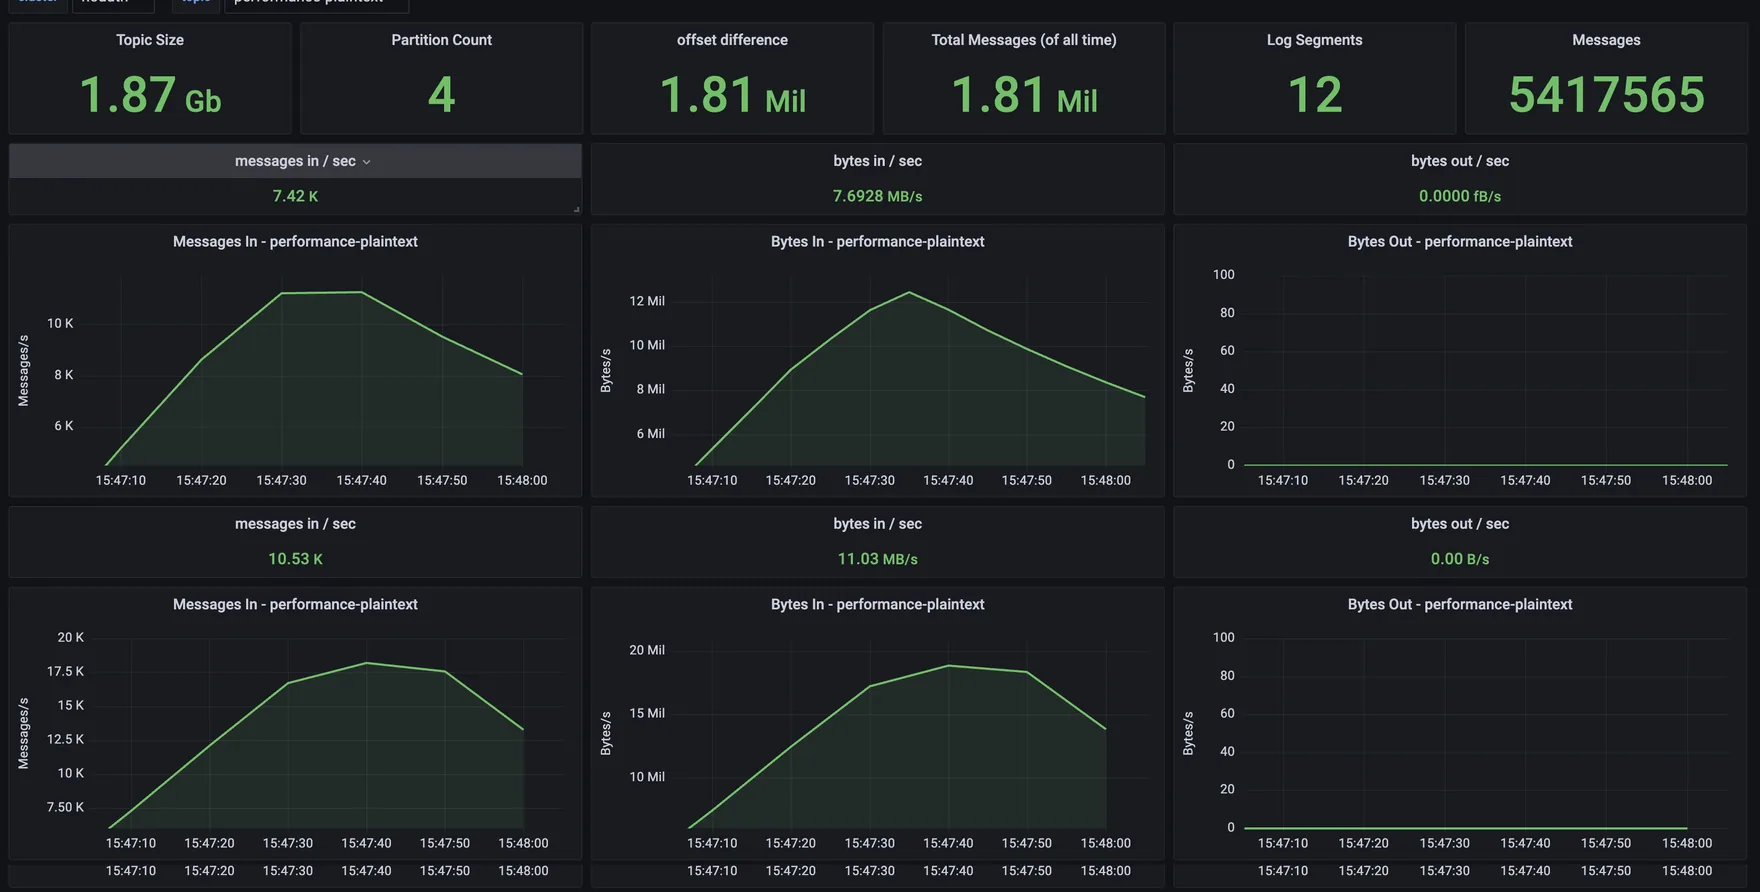
The setup of Grafana isn't simple, but if the pieces are in place and validated, then it gets easier. Assuming you have Prometheus integrated and variables configured, you can quickly add in a query. If you are like us, however, you will experiment with various panels and tweak their display and size.
Configuration
The heart of the configuration is writing a query that aligns with what you found in Prometheus. Use the Prometheus UI to confirm you have it correct. Grafana provides documentation on writing queries. Understanding by and without is key to writing queries that split or combine measurements.
simple query
sum ( kafka_server_brokertopicmetrics_oneminuterate { name="MessagesInPerSec", cluster_id =~ "$cluster", topic = "${topic}", cluster_type="kafka" })more advanced query
sum without(instance,job) ( kafka_server_brokertopicmetrics_oneminuterate { name="MessagesInPerSec", topic!~"(_)+confluent.+", topic!="", cluster_id=~"${cluster}", cluster_type="kafka" })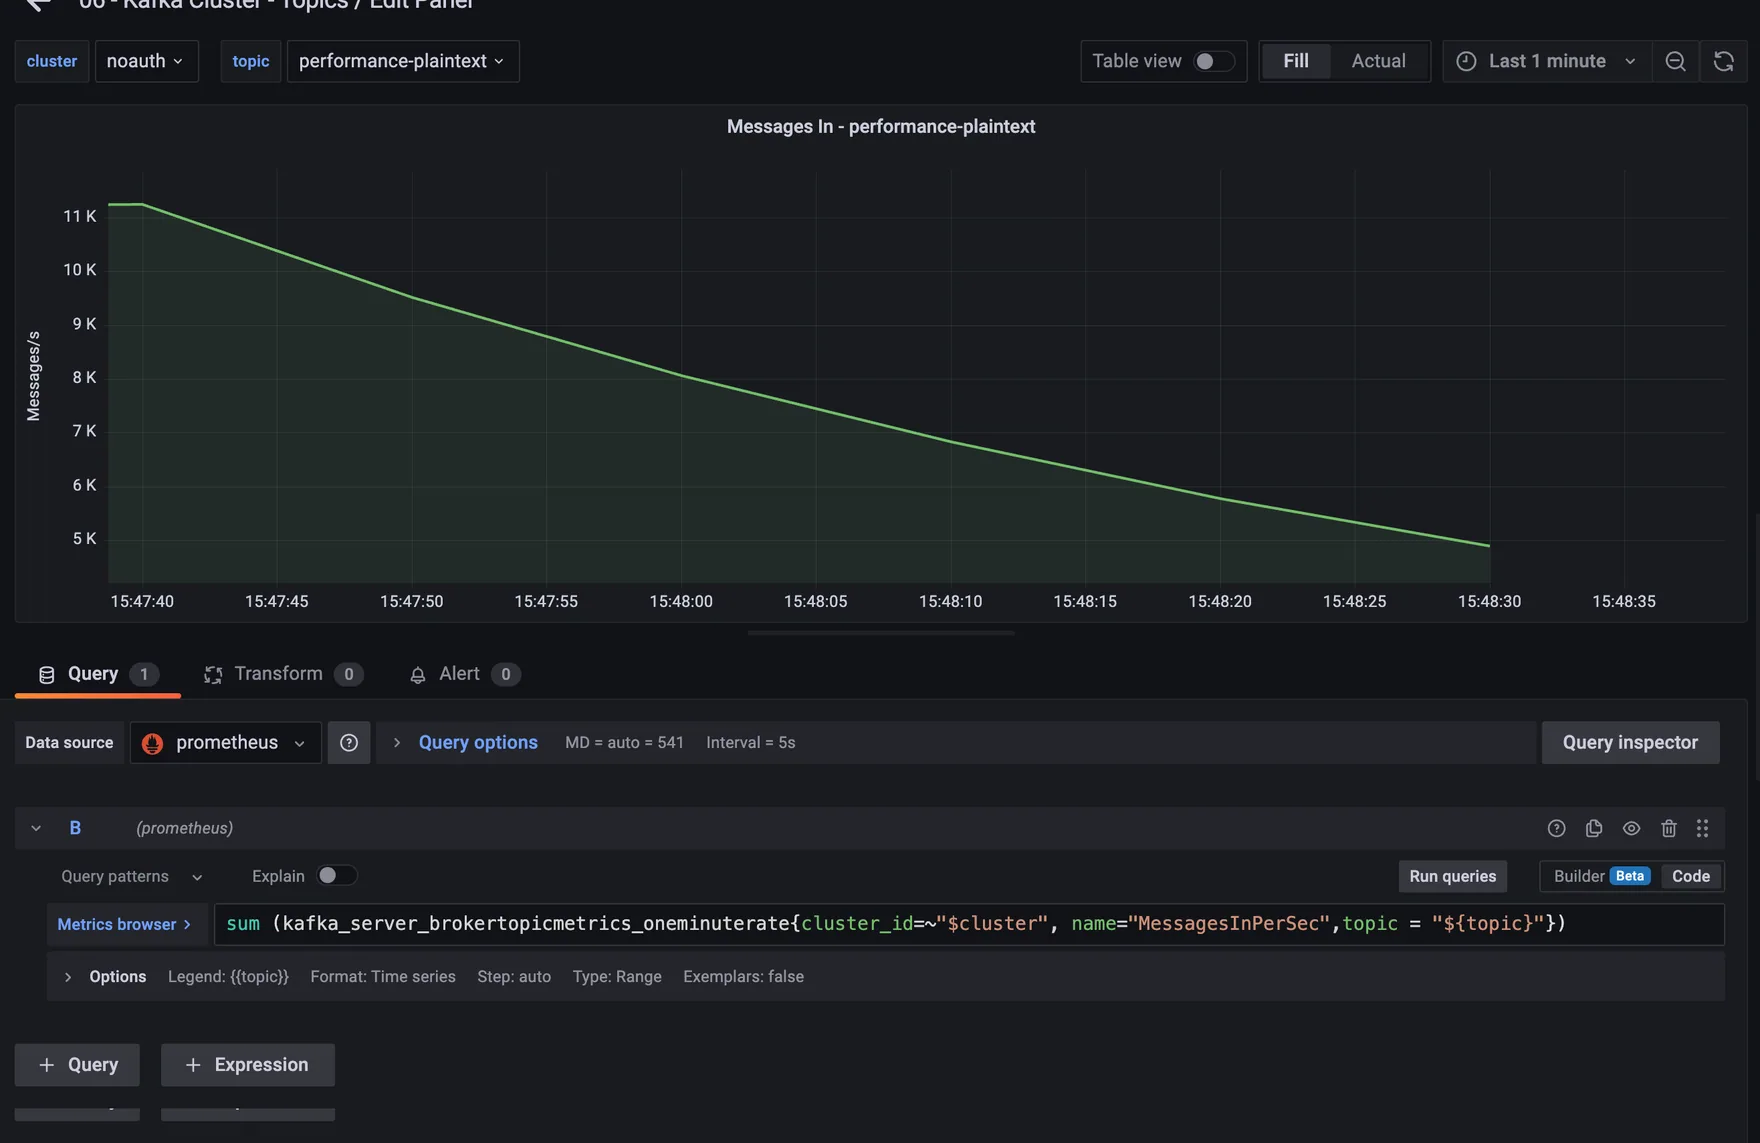
Grafana queries depend on the configuration of JMX Prometheus Exporter and Prometheus.
Showcase
We are quite happy with the Grafana dashboards. The review isn't about them, but about the success in using Grafana to access and display the metrics across the multiple cluster configurations.
4 Clusters
The clusters used for analysis are from the first article in this series, Kafka Toolage: Setup.
| cluster | listener type - 9092 | listener type - 9093 | schema registry | kafka connect |
|---|---|---|---|---|
| noauth | plaintext | ssl | http | http |
| sasl | sasl_plaintext (plain) | sasl_ssl (scram) | https / basic auth | https / basic auth |
| ssl | - | ssl | https / basic auth | https / basic auth |
| oauth | sasl_plaintext (plain) | sasl_ssl (oauth) | n/a | n/a |
Cluster Health
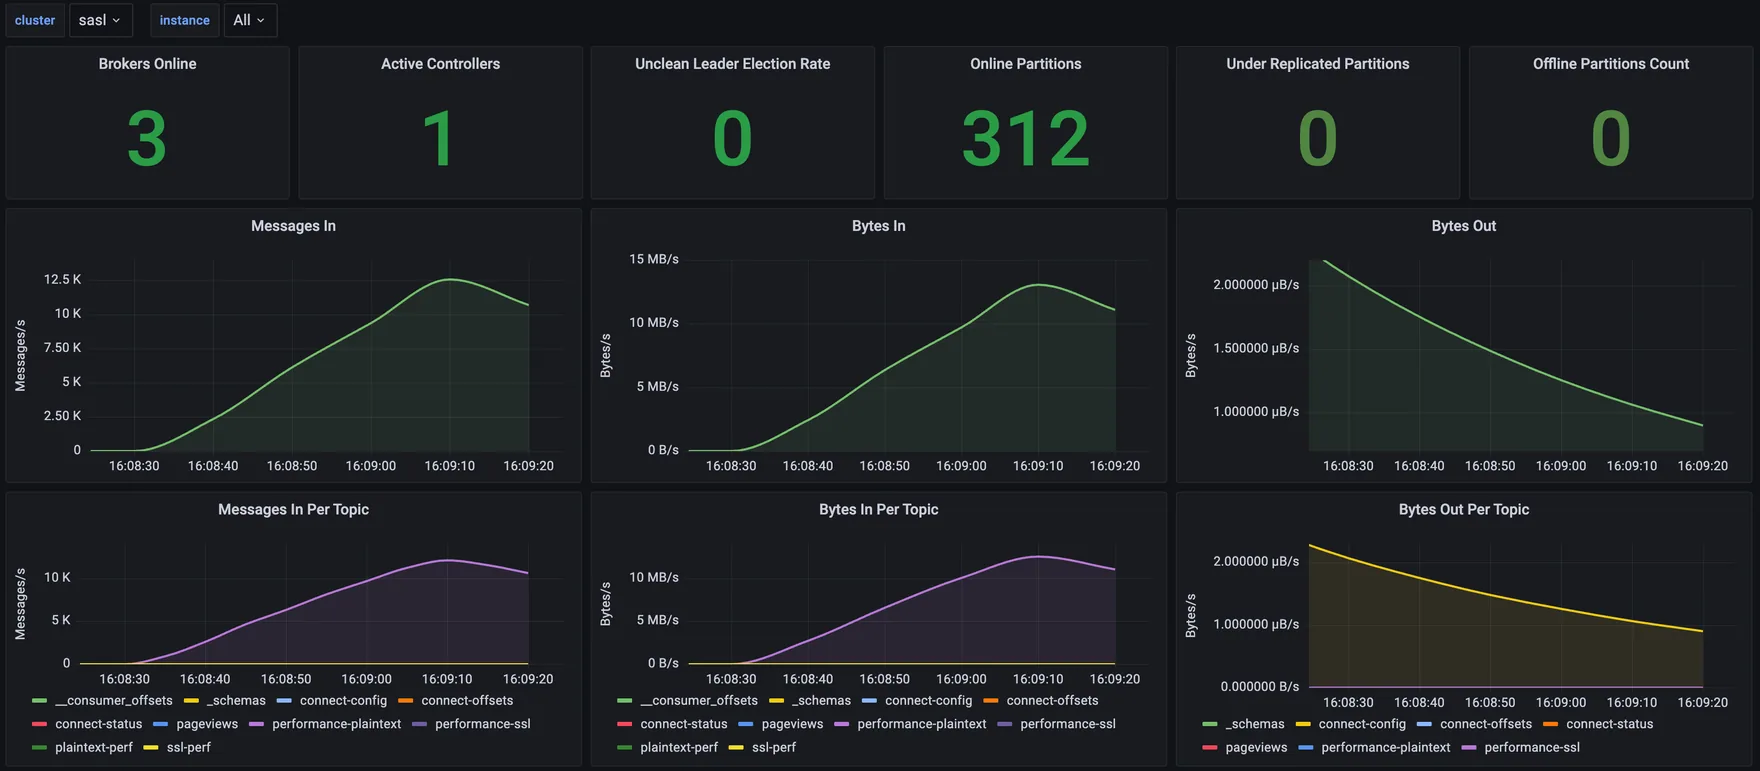
A single dashboard can be stood up to give the health of the cluster.
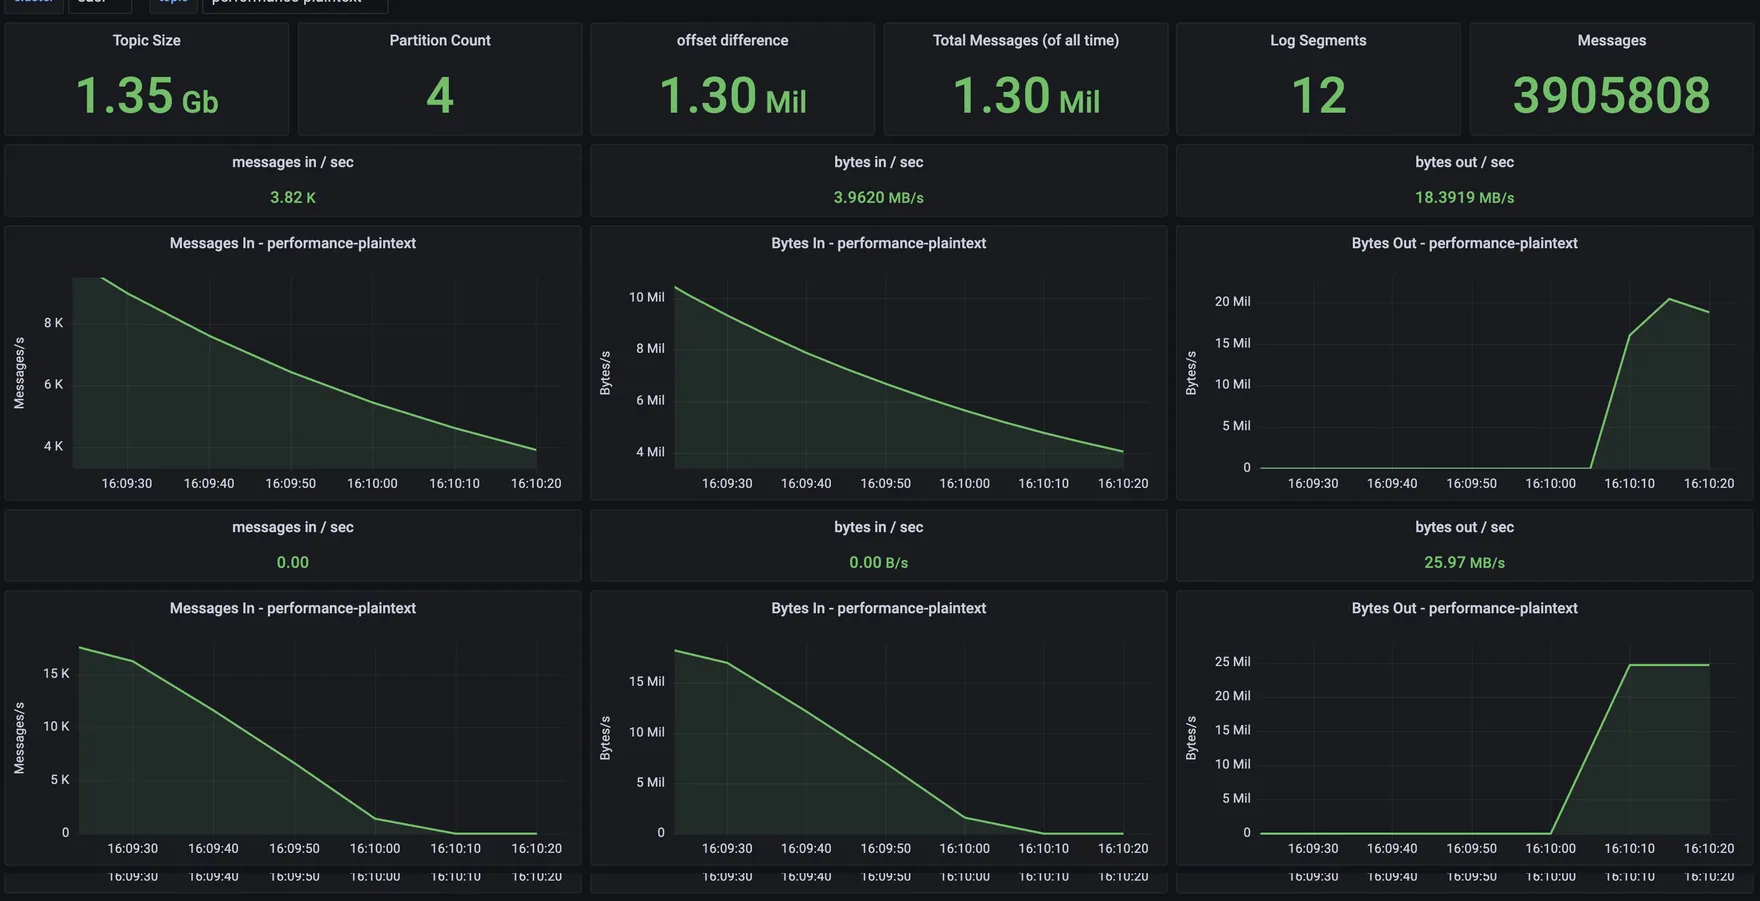
Topic
A single dashboard can provide drill-down into the messages and bytes in and bytes out.
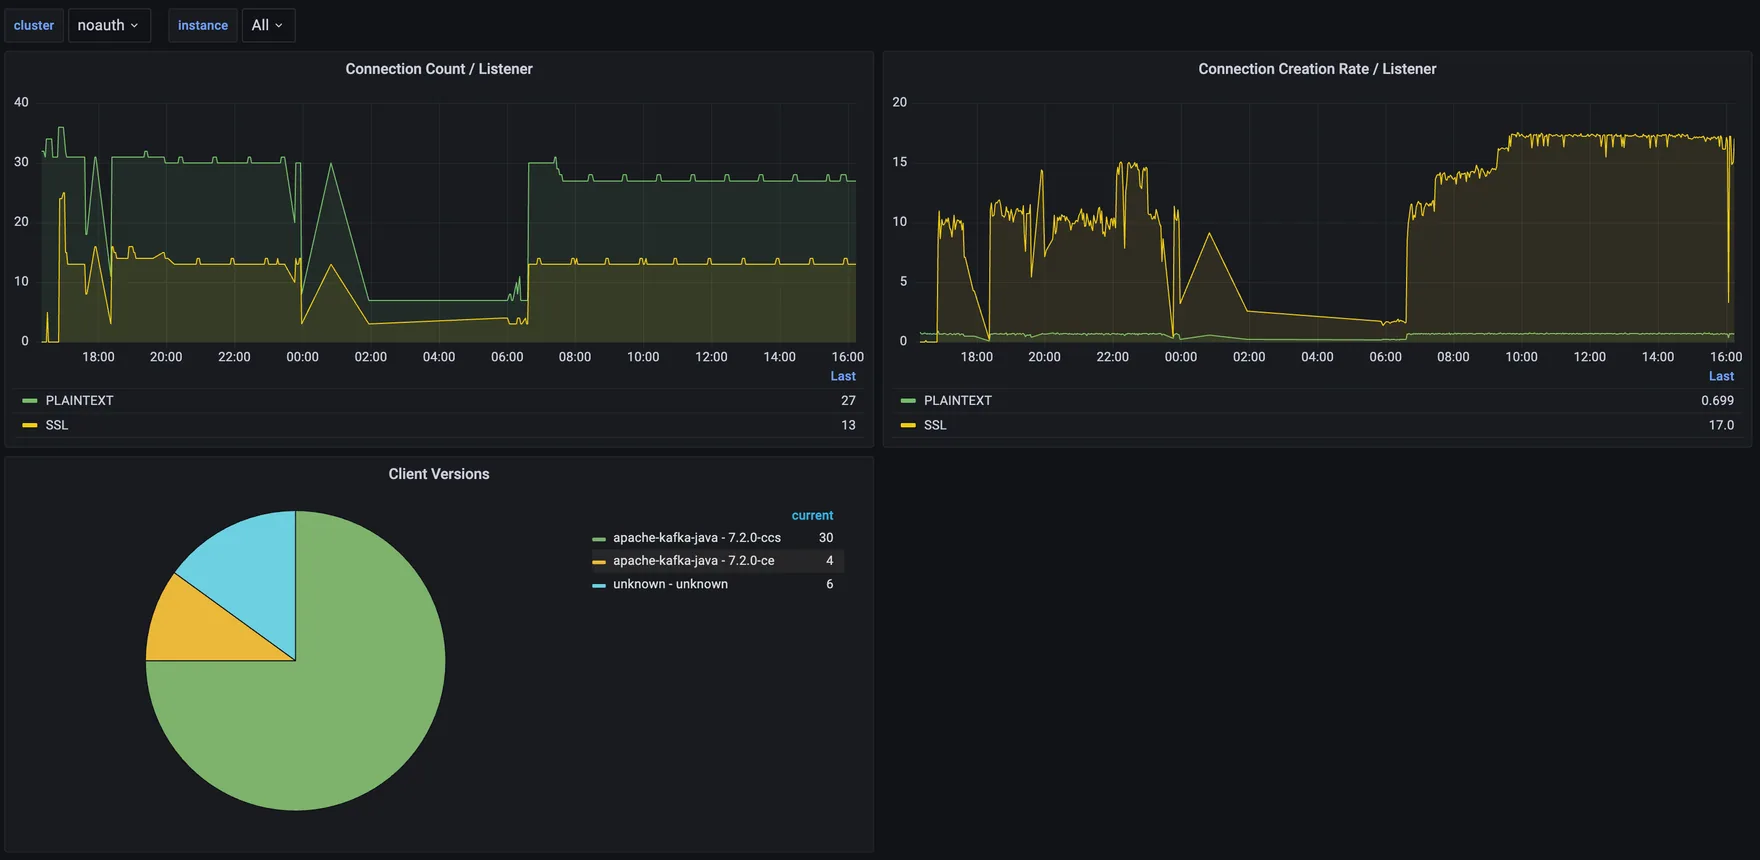
Connections (Listeners)
If a cluster has multiple listeners, the information on each listener can be tracked.
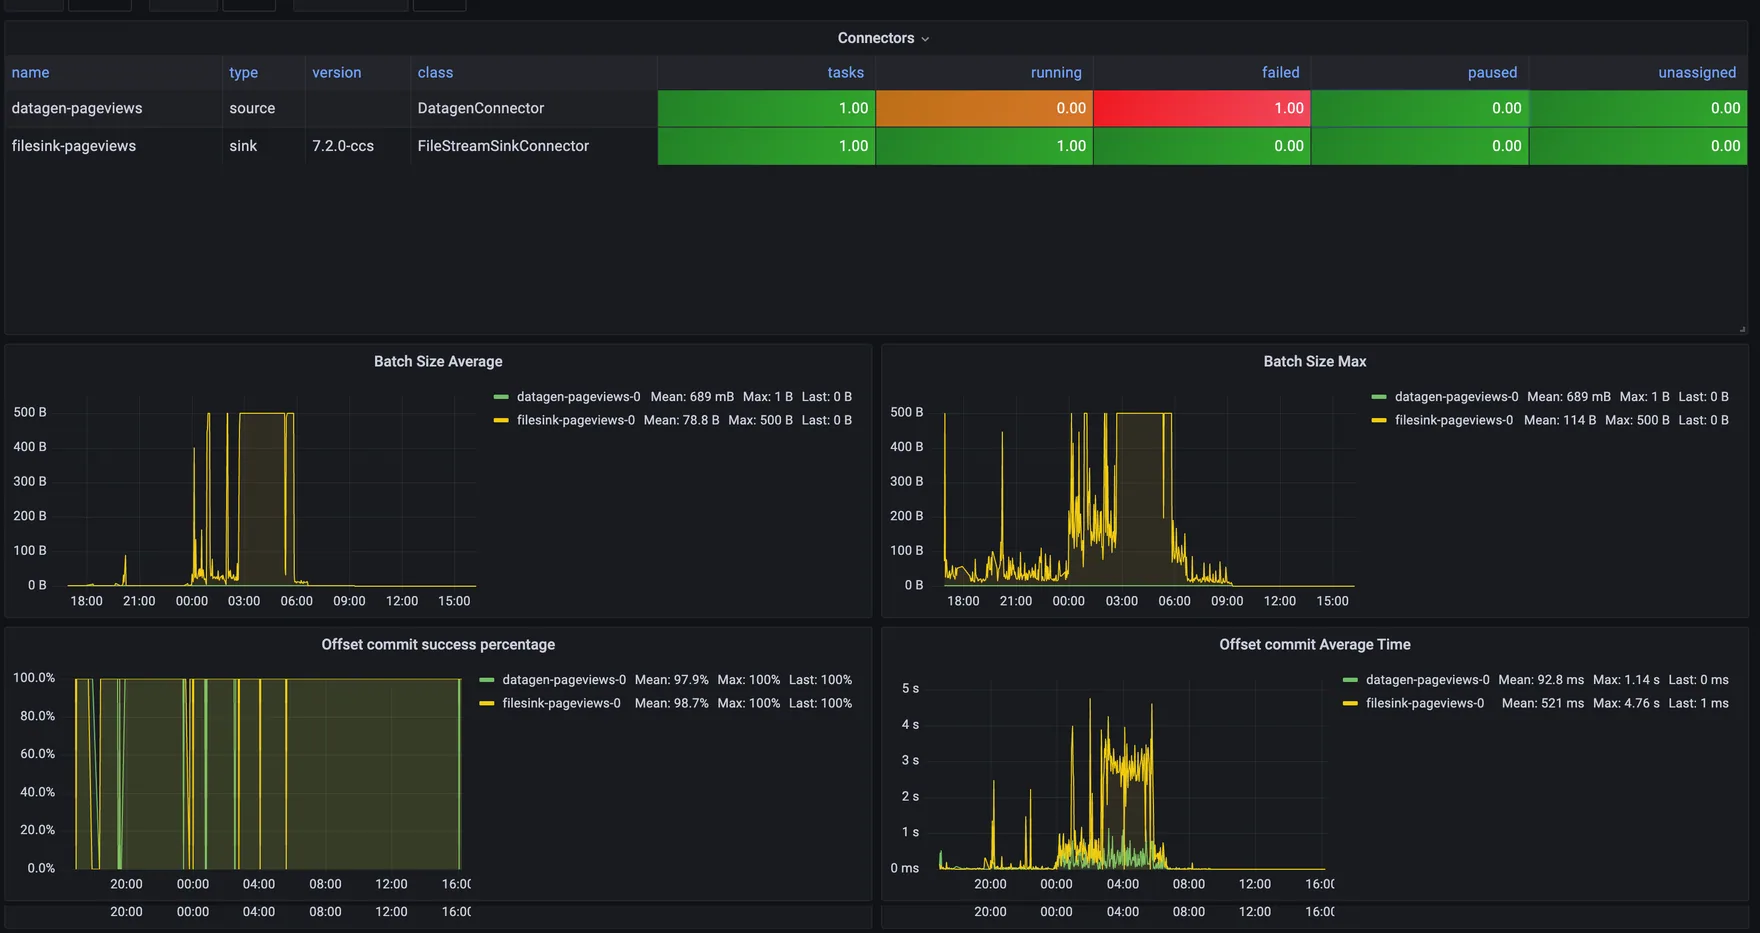
Kafka Connect
A single dashboard for each Kafka Connect cluster, even if there are multiple clusters for a single Kafka cluster.
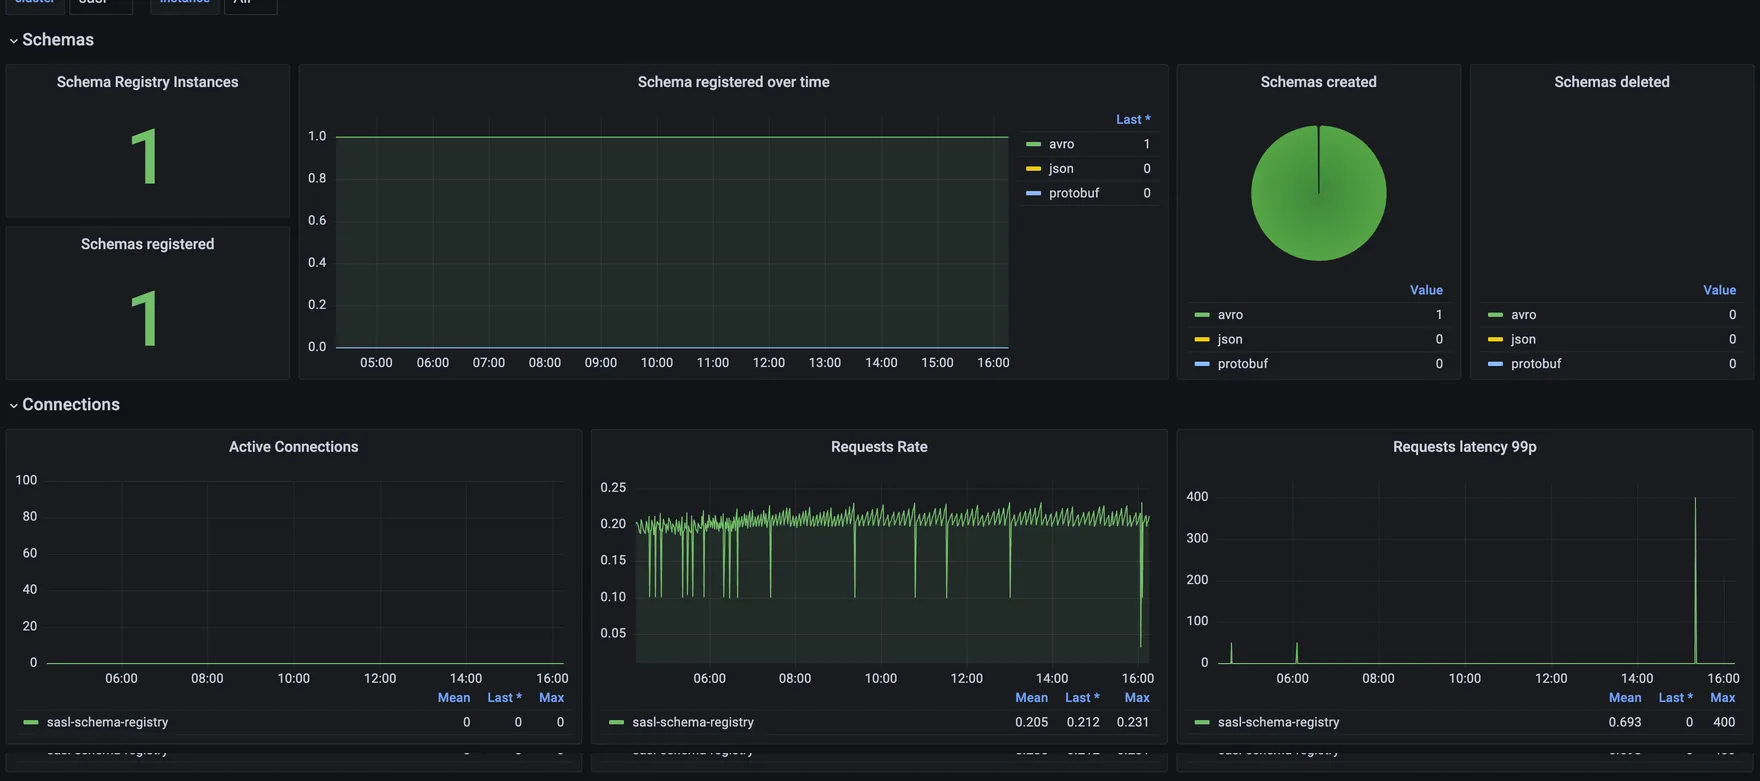
Confluent Schema Registry
Metrics of each Schema Registry are also available.
To see more, check out the demonstration project kafka-toolage. All shown dashboards are available for your evaluation.
Review
Grafana falls primarily under the Monitoring classification as stated in the setup article.
Classification
We classify tools in three areas: monitoring, observation, and administration. Review of tools is based on their purpose/design. Grafana is a monitoring tool, and the review is based on the supported functionality.
| functionality | |
|---|---|
| monitoring | ✔ |
| observation | 𐄂 |
| administration | 𐄂 |
Connectivity
100% successful in connecting to every deployed component.
| Cluster | Service | Protocol¹ | result |
|---|---|---|---|
| noauth | broker | JMX (HTTP) | ✔ |
| noauth | schema-registry | JMX (HTTP) | ✔ |
| noauth | connect (a) | JMX (HTTP) | ✔ |
| noauth | connect (b) | JMX (HTTP) | ✔ |
| ssl | broker | JMX (HTTP) | ✔ |
| ssl | schema-registry | JMX (HTTP) | ✔ |
| ssl | connect | JMX (HTTP) | ✔ |
| sasl | broker | JMX (HTTP) | ✔ |
| sasl | schema-registry | JMX (HTTP) | ✔ |
| sasl | connect | JMX (HTTP) | ✔ |
| oauth | broker | JMX (HTTP) | ✔ |
While every cluster other than ssl has two Kafka protocols, the distinction isn't applicable for monitoring tools that use JMX.
Deployments Needed
Only a single deployment of Grafana is needed to observe all Kafka clusters and their respective Connect clusters and Schema Registries.
Ratings
These ratings are subjective. Rating Grafana is difficult: we have worked with it for four years, constantly changing queries and dashboards, and it's hard to fully set that experience aside. What we discovered: the dashboards we had already built had errors and were incomplete; they required modifications to support multiple instances.
Rating Classification: 1 difficult/rigid to 10 easy/customizable
| classification | rating | summary |
|---|---|---|
| setup | 1¹ | coupling of dashboards to jmx exporter makes it difficult to borrow from other provided dashboards |
| success | 10 | was able to access all metrics for all components in all clusters |
| customizable | 9 | very customizable, which is great but also means more time to set up and use |
| completeness | 8 | full access to all the metrics, provided all clusters expose their metrics the same way |
| integration | 8 | free to write your own queries, dashboards, and variables |
| ease-of-use | 8 | once dashboards are built, easy to use |
¹ When we started this review, our dashboards were already built. The variables and the ability to move between Apache Kafka clusters and Kafka Connect clusters were failing - we had to modify the dashboards to support multiple clusters. While successful, it took additional time.
Conclusion
Monitoring is a vital component of your Kafka cluster and Apache Kafka applications. For open-source options Grafana is the standard. It's unclear how the licensing change impacts enterprise adoption of Grafana.
While Grafana is a big effort to set up and configure, once configured, it is quite stable and provides a rich set of information for your development and operational teams.
Because this setup relies on metrics exposed via JMX, its use is limited to self-managed installations.
Working on something like this?
Start a Conversation