%20scale(0.1008)'%3e%3cpath%20d='M165-700L80-700L80%200L165%200L165-340L455%200L560%200L242-372L545-700L440-700L165-399L165-700ZM1085-700L685-700L685%200L1085%200L1085-80L770-80L770-340L1065-340L1065-420L770-420L770-620L1085-620L1085-700Z'%20fill='%23FFFFFF'%3e%3c/path%3e%3c/g%3e%3c/svg%3e)
%20scale(0.1008)'%3e%3cpath%20d='M165-700L80-700L80%200L165%200L165-340L455%200L560%200L242-372L545-700L440-700L165-399L165-700ZM1085-700L685-700L685%200L1085%200L1085-80L770-80L770-340L1065-340L1065-420L770-420L770-620L1085-620L1085-700Z'%20fill='%2316294B'%3e%3c/path%3e%3c/g%3e%3c/svg%3e)
'%3e%3cpath%20d='M165-700L80-700L80%200L165%200L165-340L455%200L560%200L242-372L545-700L440-700L165-399L165-700ZM890-700L805-700L805%200L890%200L890-700ZM1825-700L1740-700L1740-179L1210-735L1210%200L1295%200L1295-521L1825%2035L1825-700ZM2545-700L2145-700L2145%200L2545%200L2545-80L2230-80L2230-340L2525-340L2525-420L2230-420L2230-620L2545-620L2545-700ZM2785-700L2785-620L2965-620L2965%200L3050%200L3050-620L3230-620L3230-700L2785-700ZM3565-700L3480-700L3480%200L3565%200L3565-700ZM3935-350L3935-350Q3935-432%203971.500-493.500Q4008-555%204067-590Q4126-625%204195-625L4195-625Q4245-625%204286.500-612Q4328-599%204362-575.500Q4396-552%204420-521L4420-521L4420-633Q4376-672%204324-691Q4272-710%204195-710L4195-710Q4122-710%204058.500-683.500Q3995-657%203947-608.500Q3899-560%203872-494Q3845-428%203845-350L3845-350Q3845-272%203872-206Q3899-140%203947-91.500Q3995-43%204058.500-16.500Q4122%2010%204195%2010L4195%2010Q4272%2010%204324-9Q4376-28%204420-67L4420-67L4420-179Q4396-148%204362-124.500Q4328-101%204286.500-88Q4245-75%204195-75L4195-75Q4126-75%204067-110Q4008-145%203971.500-207Q3935-269%203935-350ZM5590-700L5190-700L5190%200L5590%200L5590-80L5275-80L5275-340L5570-340L5570-420L5275-420L5275-620L5590-620L5590-700ZM6110-700L5900-700L5900%200L6110%200Q6212%200%206291-44Q6370-88%206415-166.500Q6460-245%206460-350Q6460-455%206415-533.500Q6370-612%206291-656Q6212-700%206110-700L6110-700ZM6110-85L5985-85L5985-615L6110-615Q6169-615%206218-596.500Q6267-578%206302-543.500Q6337-509%206356-460Q6375-411%206375-350Q6375-289%206356-240Q6337-191%206302-156.500Q6267-122%206218-103.500Q6169-85%206110-85L6110-85ZM7065-355L7065-275L7298-275Q7289-234%207269.500-198Q7250-162%207220-134Q7190-106%207148.500-90.500Q7107-75%207055-75L7055-75Q6981-75%206921-110Q6861-145%206825.500-207Q6790-269%206790-350L6790-350Q6790-432%206825.500-493.500Q6861-555%206921-590Q6981-625%207055-625L7055-625Q7135-625%207194-593.500Q7253-562%207286-506L7286-506L7346-561Q7316-610%207272.500-643Q7229-676%207174.500-693Q7120-710%207055-710L7055-710Q6979-710%206914-683.500Q6849-657%206801-608.500Q6753-560%206726.500-494Q6700-428%206700-350L6700-350Q6700-272%206726.500-206Q6753-140%206801-91.500Q6849-43%206914-16.500Q6979%2010%207055%2010L7055%2010Q7135%2010%207197.500-19.500Q7260-49%207303-100Q7346-151%207368-216.500Q7390-282%207390-355L7390-355L7065-355ZM8075-700L7675-700L7675%200L8075%200L8075-80L7760-80L7760-340L8055-340L8055-420L7760-420L7760-620L8075-620L8075-700Z'%20fill='%2316294B'%3e%3c/path%3e%3c/g%3e%3c/svg%3e)
'%3e%3cpath%20d='M165-700L80-700L80%200L165%200L165-340L455%200L560%200L242-372L545-700L440-700L165-399L165-700ZM890-700L805-700L805%200L890%200L890-700ZM1825-700L1740-700L1740-179L1210-735L1210%200L1295%200L1295-521L1825%2035L1825-700ZM2545-700L2145-700L2145%200L2545%200L2545-80L2230-80L2230-340L2525-340L2525-420L2230-420L2230-620L2545-620L2545-700ZM2785-700L2785-620L2965-620L2965%200L3050%200L3050-620L3230-620L3230-700L2785-700ZM3565-700L3480-700L3480%200L3565%200L3565-700ZM3935-350L3935-350Q3935-432%203971.500-493.500Q4008-555%204067-590Q4126-625%204195-625L4195-625Q4245-625%204286.500-612Q4328-599%204362-575.500Q4396-552%204420-521L4420-521L4420-633Q4376-672%204324-691Q4272-710%204195-710L4195-710Q4122-710%204058.500-683.500Q3995-657%203947-608.500Q3899-560%203872-494Q3845-428%203845-350L3845-350Q3845-272%203872-206Q3899-140%203947-91.500Q3995-43%204058.500-16.500Q4122%2010%204195%2010L4195%2010Q4272%2010%204324-9Q4376-28%204420-67L4420-67L4420-179Q4396-148%204362-124.500Q4328-101%204286.500-88Q4245-75%204195-75L4195-75Q4126-75%204067-110Q4008-145%203971.500-207Q3935-269%203935-350ZM5590-700L5190-700L5190%200L5590%200L5590-80L5275-80L5275-340L5570-340L5570-420L5275-420L5275-620L5590-620L5590-700ZM6110-700L5900-700L5900%200L6110%200Q6212%200%206291-44Q6370-88%206415-166.500Q6460-245%206460-350Q6460-455%206415-533.500Q6370-612%206291-656Q6212-700%206110-700L6110-700ZM6110-85L5985-85L5985-615L6110-615Q6169-615%206218-596.500Q6267-578%206302-543.500Q6337-509%206356-460Q6375-411%206375-350Q6375-289%206356-240Q6337-191%206302-156.500Q6267-122%206218-103.500Q6169-85%206110-85L6110-85ZM7065-355L7065-275L7298-275Q7289-234%207269.500-198Q7250-162%207220-134Q7190-106%207148.500-90.500Q7107-75%207055-75L7055-75Q6981-75%206921-110Q6861-145%206825.500-207Q6790-269%206790-350L6790-350Q6790-432%206825.500-493.500Q6861-555%206921-590Q6981-625%207055-625L7055-625Q7135-625%207194-593.500Q7253-562%207286-506L7286-506L7346-561Q7316-610%207272.500-643Q7229-676%207174.500-693Q7120-710%207055-710L7055-710Q6979-710%206914-683.500Q6849-657%206801-608.500Q6753-560%206726.500-494Q6700-428%206700-350L6700-350Q6700-272%206726.500-206Q6753-140%206801-91.500Q6849-43%206914-16.500Q6979%2010%207055%2010L7055%2010Q7135%2010%207197.500-19.500Q7260-49%207303-100Q7346-151%207368-216.500Q7390-282%207390-355L7390-355L7065-355ZM8075-700L7675-700L7675%200L8075%200L8075-80L7760-80L7760-340L8055-340L8055-420L7760-420L7760-620L8075-620L8075-700Z'%20fill='%23FFFFFF'%3e%3c/path%3e%3c/g%3e%3c/svg%3e)
Kafka Raft (KRaft)
First written December 2022, last updated September 2026.
Here are the steps and a reference project for setting up Kafka without ZooKeeper, with a dedicated controller quorum, using the Confluent community-licensed container images. A Grafana dashboard to observe the new metrics is also provided.
Introduction
KRaft moves Kafka's metadata consensus out of ZooKeeper and into Kafka itself. With this change, the role of a Kafka instance can be that of a controller, broker, or both. Getting this configuration stood up required some tweaks to the Confluent cp-kafka image before version 7.5.
If you want a deeper understanding of the design and implementation details, check out Confluent's Kafka Internals course. Specifically, the control-plane section.
Configuration
There are many configuration parameters with Apache Kafka; highlighted here are the ones necessary to build out the cluster with KRaft.
node.id
The property node. replaces broker.. Be sure that all identifiers in the cluster are unique across brokers and controllers (docs).
process.roles
A node can be a broker, a controller, or both. Set to broker,controller to enable both the controller and data planes on a node (docs).
controller.listener.names
List the listener names used for the controller. This tells a node which listener to use for that communication. While the property is a list, just like advertised., the first one is what is used for controller communication (docs).
controller.quorum.voters
A comma-delimited list of voters in the control plane, where a controller is noted as: node_ (docs). Newer Kafka versions support dynamic controller quorums, so a static voters list is no longer the only option.
example:
KAFKA_CONTROLLER_QUORUM_VOTERS: 10@controller-0:9093,11@controller-1:9093,12@controller-2:9093Additional Configuration
There are other tuning parameters for the controller plane, see the documentation for details.
Lesson Learned
Do not remove cluster settings from the dedicated controllers, since a controller is the node that performs administration operations, such as creating a topic.
Incorrectly removing these from the controllers caused topics to be created without Apache Kafka defaults.
KAFKA_DEFAULT_REPLICATION_FACTOR: 3KAFKA_NUM_PARTITIONS: 4Storage
Another change to setting up Apache Kafka with KRaft is the storage. The storage on each node must be configured, before starting the JVM. This can be done with a kafka- command provided as part of Apache Kafka. With cp- 7.5 and later, the container runs kafka- on start-up if the storage directory doesn't exist, so only the cluster UUID needs to be provided.
- Generate a unique UUID for the cluster; you can use
kafka-or another means.storage random- uuid - Before starting the cluster, format the metadata storage with
kafka-.storage format
kafka-storage format -t $KAFKA_CLUSTER_ID -c <server.properties>Seeing It In Action
If you are interested in seeing all this in action, check out the kafka-raft docker-compose setup in the dev-local project. It's a fully working example with 3 controllers and 4 brokers.
Metrics
If you are going to deploy Kafka with KRaft to production, having visibility into metrics is important. That visibility matters as much as having dedicated controllers, maybe more. The key with dashboards is to ensure they report correctly whether the data and control planes are separate or combined.
Grafana
Building a Grafana dashboard is a multi-step process: extract the metrics, store them in a time-series database (e.g. Prometheus), then visualize the collected metrics in Grafana.
JMX Prometheus Exporter
The KRaft Monitor metrics are defined in the documentation, with an MBean name, such as kafka.. Using a JMX client, such as jmxterm, shows the MBean name is just kafka. with each metric an attribute in that bean. This differed from the documentation at the time of writing.
If you deploy Java applications with JMX metrics in containers, we highly recommend jmxterm.
java -jar jmxterm.jarIn the cp containers, the Java process is process 1, but use the command jvms to see all available processes and verify the JVM’s process ID is indeed 1.
$>open 1Show all the MBeans in the JVM, with beans.
$>beans...kafka.server:type=raft-metrics...Select a bean and use info to explore the attributes on a bean and get to fetch the current value of an attribute.
$>bean kafka.server:type=raft-metrics#bean is set to kafka.server:type=raft-metrics$>info# attributes%0 - append-records-rate (double, r)%1 - commit-latency-avg (double, r)%2 - commit-latency-max (double, r)%3 - current-epoch (double, r)%4 - current-leader (double, r)%5 - current-state (double, r)%6 - current-vote (double, r)%7 - election-latency-avg (double, r)%8 - election-latency-max (double, r)%9 - fetch-records-rate (double, r)%10 - high-watermark (double, r)%11 - log-end-epoch (double, r)%12 - log-end-offset (double, r)%13 - number-unknown-voter-connections (double, r)%14 - poll-idle-ratio-avg (double, r)$>get current-leadercurrent-leader = 10.0;Using the above, the following properly exposes these from JMX Prometheus Exporter. Since the current- attribute value is a string, its value needs to be associated with a label to capture it in Prometheus.
rules:- pattern: "kafka.server<type=raft-metrics><>(current-state): (.+)" name: kafka_server_raft_metrics labels: name: $1 state: $2 value: 1- pattern: "kafka.server<type=raft-metrics><>(.+): (.+)" name: kafka_server_raft_metrics labels: name: $1Grafana Dashboard
Grafana is great for custom configuration, but that means time and effort are needed to build dashboards. Here is a dashboard around some of those KRaft metrics; it isn't a complete dashboard.
Node Information
With metrics emitting, put them into a Grafana dashboard.
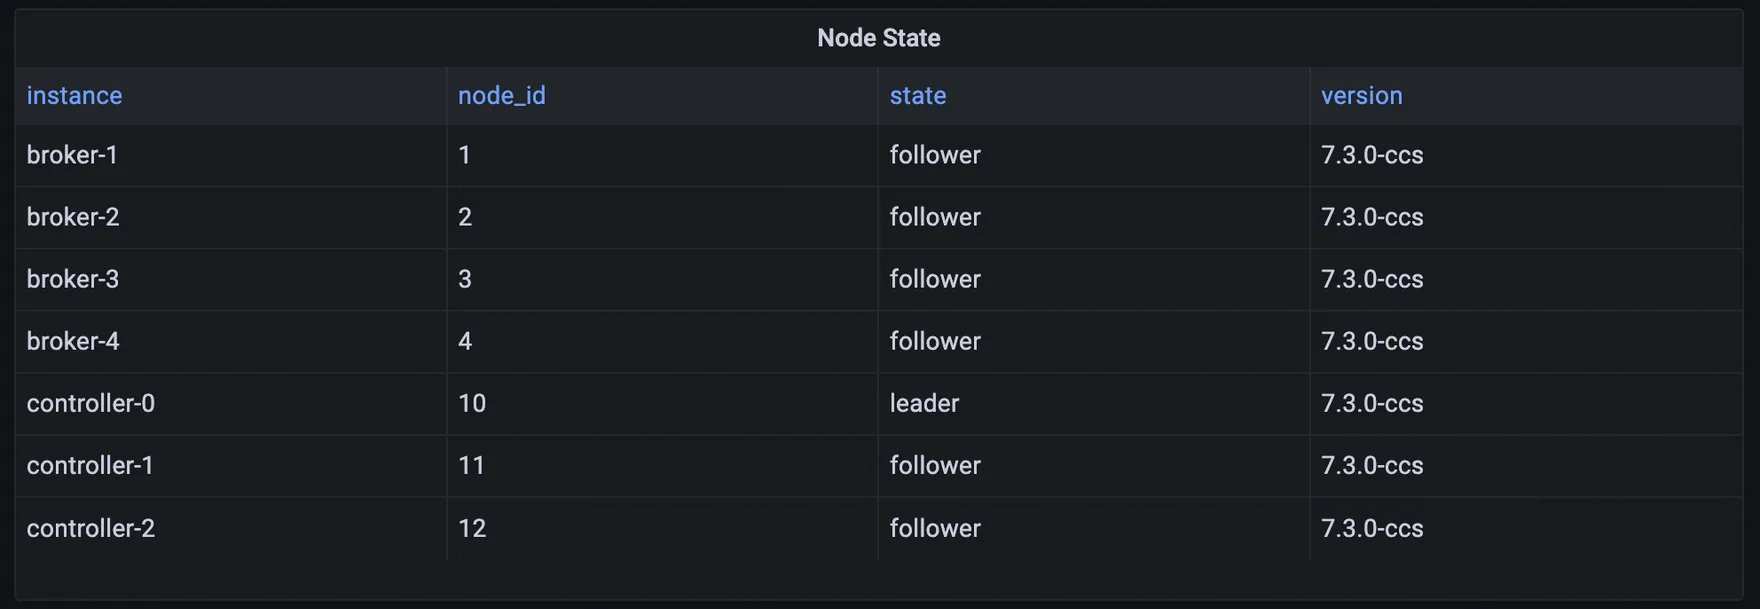
Using current-, we can see which node is the leader, in addition to capturing node.. In addition, the dashboard component joins in other data to provide additional information on each node.
Node Counts
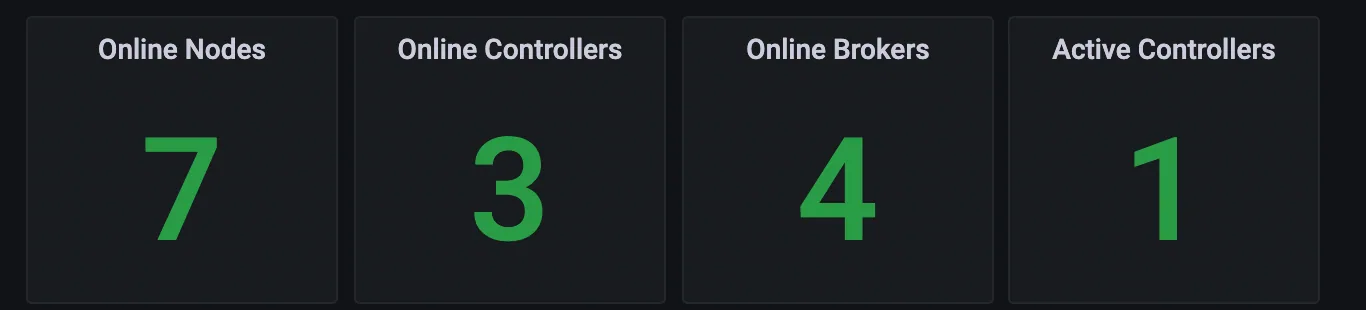
Counts of nodes and active controllers are always reassuring, and this uses an existing metric, kafka_. This metric is only emitted from a controller, so by counting the existence of this metric you see the number of controllers in the cluster, and by summing the value of the metric you get the actual number of active controllers; alert if this is ever not equal to 1.
Check out the dashboard to see how the other values are calculated, as it is the same as in the ZooKeeper-based installations.
Active Controller
To get the node. of the quorum leader, just find max(kafka_. Because scraping of each node is from slightly different times, different values are possible at the time of a change; max is used to make the single value display easy to build.
If a new leader is being elected, it shows up in the voted-leader metric. In a single-value panel this isn't very useful, but it is worth recording as a time series.

Full Dashboard
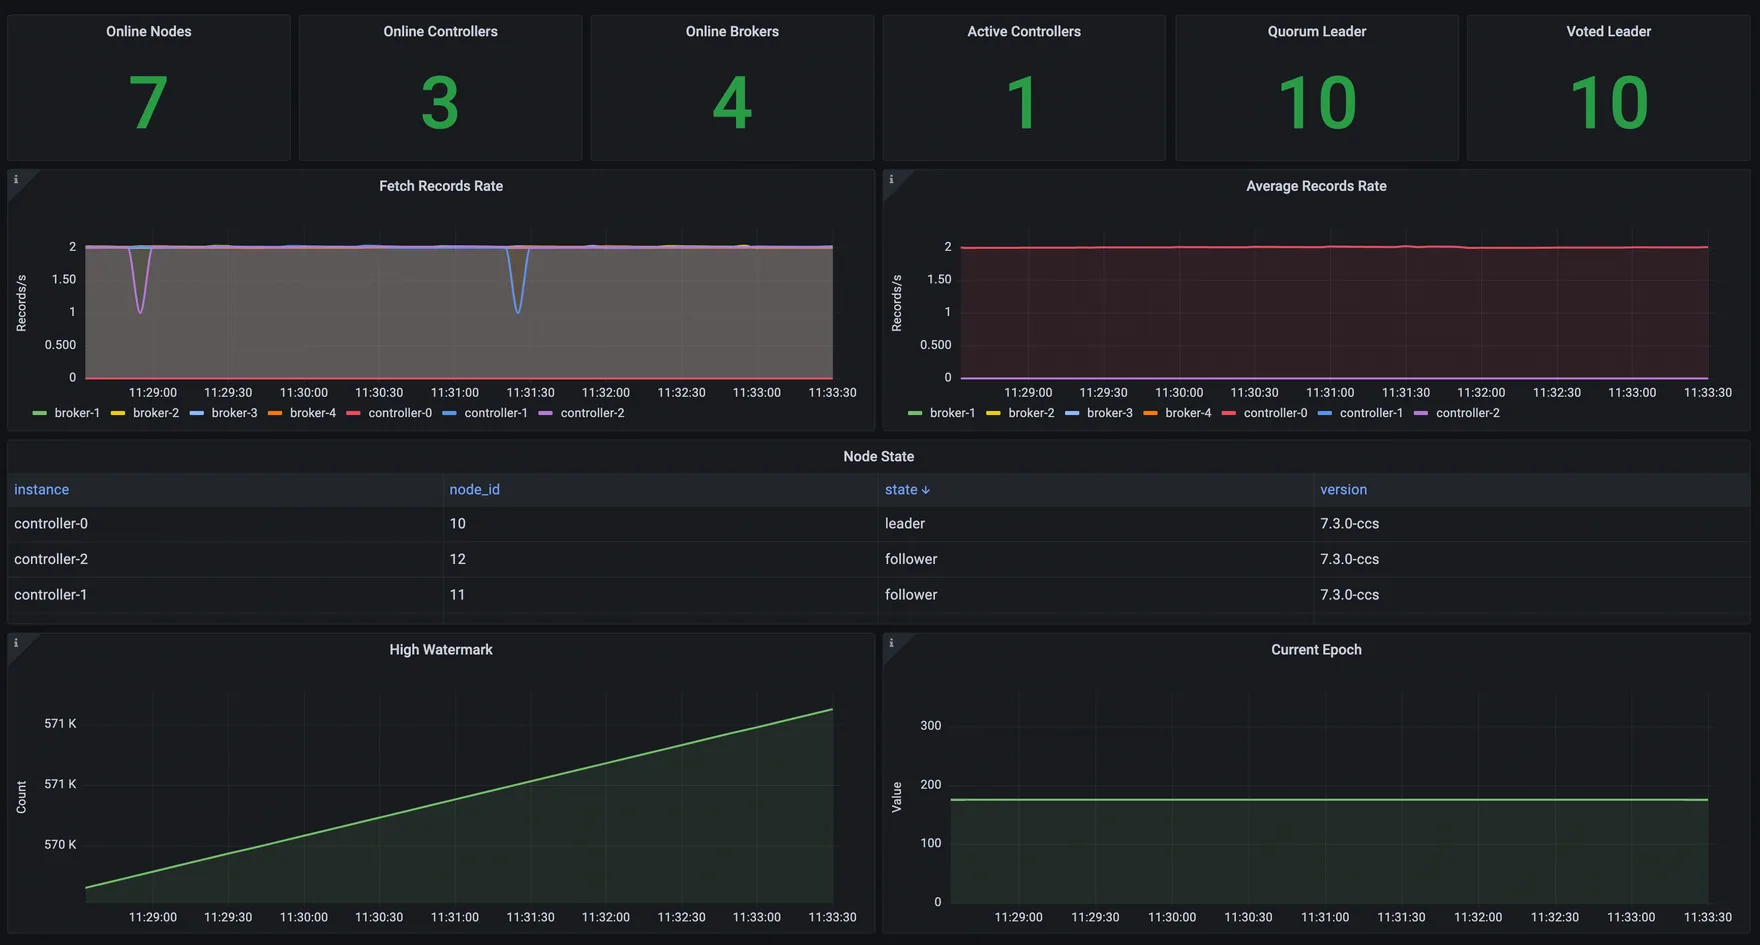
Here is an example dashboard that also captures the fetch rate of the controller metadata.
Open-Source Tools
At the time of writing, we checked a variety of open-source tools and could not see KRaft metrics in any of them; active-controller information displayed incorrectly. None of the tools we tried supported KRaft yet, but it is important that before you upgrade, you have a proper monitoring and alerting strategy in place.
Before you move to KRaft
Be sure you properly test your monitoring and Apache Kafka support infrastructure as part of your move to KRaft. Also, validate that kafka-raft metrics are captured and confirm that dashboards and tools work when brokers and controllers are on separate nodes.
Working on something like this?
Start a Conversation